One of my most used means of monitoring what’s going on at a remote Linux server, is looking at the log lines that each daemon or client program writes to the disk. Using this technique you can see a real time view about what is happening and find out if there are any outstanding errors or optimizations in your configuration. I am going to show how I tackle this task and what tricks I use to make tons of lines of dull text more readable.
tail
The easiest way to look at a log file in realtime is to use tail
tail -f /var/log/syslog
This will add new lines to the bottom of the screen, as they are written to the file. But tail can be used to look at more than one file as well.
tail -f /var/log/syslog /var/log/auth.log /var/log/apache/error.log
This will mark the lines of each log file with a header, so you know where they are coming from.
If you are a night owl like me, you could come into the situation that your log files get rotated as you’re looking at them, which would let them vanish from your view. To remedy this, you can use tail’s follow mode like this:
tail -F /var/log/syslog /var/log/kern.log
I am using this with quite a long list of logs, specific to each server I am looking at, basically every day.
Having text in only one color on your screen, takes quite a bit of time and concentration, if you want to derive anything useful from it. That’s why I am using a tool called grc – The the Generic Colouriser to color the output of tail.
grc tail -F /var/log/syslog /var/log/warning.log
It looks something like this:
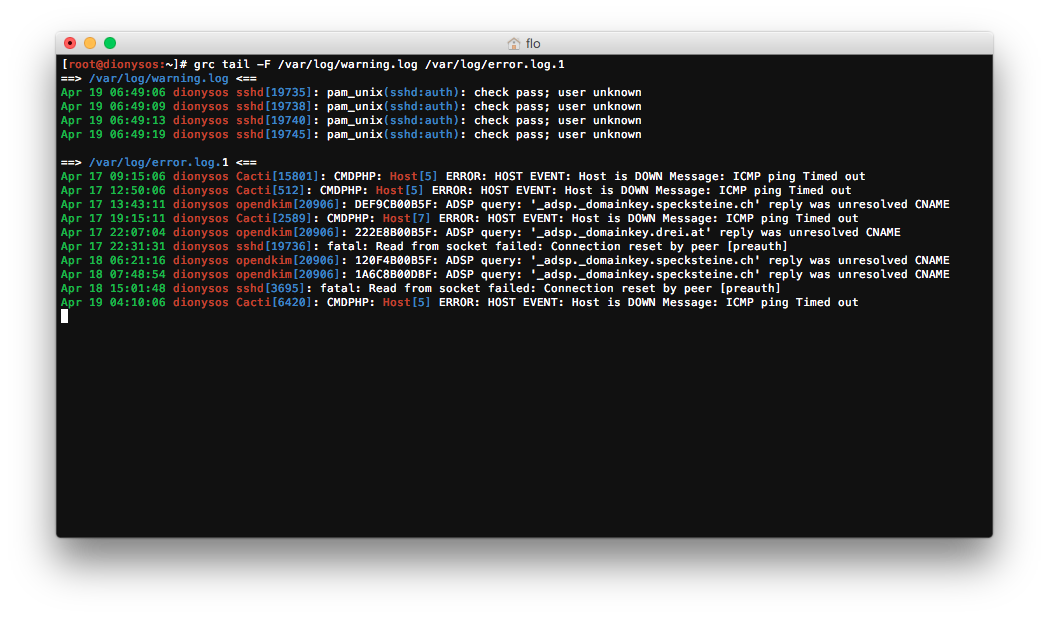 A typical call to monitor one of my servers would have around 10 to 15 files in this command.
grc color configuration
I have modified the default grc coloring settings for log files a bit to better separate common fields like email or IP addresses and the like. On a Debian Linux system, if you install grc through apt, the color configurations are stored in /usr/share/grc/. Here is my modified conf.log file:
# this configuration file is suitable for displaying kernel log files

# display this line in yellow and stop further processing
regexp=.*last message repeated \d+ times$
colours=yellow
count=stop
======
# this is date
regexp=^... (\d| )\d \d\d:\d\d:\d\d(\s[\w\d]+?\s)
colours=green, green, red
count=once
======
# everything in parentheses
regexp=\(.+?\)
colours=blue
count=more
======
# everything in `'
regexp=\`.+?\'
colours=bold yellow
count=more
======
# this is probably a pathname
regexp=/[a-zA-Z_/\.\-]+
colours=blue
count=more
======
# everything in <>
regexp=\<.*?\>
colours=blue
count=more
======
# name of process and pid
regexp=([\w/\.\-]+)(\[\d+?\])
colours=bold blue, bold red
count=more
======
# IPv4
regexp=\d{1,3}\.\d{1,3}\.\d{1,3}\.\d{1,3}
colours=bold yellow
count=more
======
# Email address
regexp=[a-zA-z0-9\.\-\+]+\@[\w\-\.]+
colours=green
lnav
Lately I have been playing around with lnav, which has quite a few neat features. I will just list them here, since I only had very limited time to play around with them. But what I can conclude already is, that it serves very well if you are searching for dates/times or specific patterns and want to dig deeper into the events that caused them.
- Try to color the messages meaningfully (e.g. always color PIDs of one process in the same color)
- SQL like syntax to structure, search and extract log messages
- Real time view
- Filters (RegEx)
- Bar chart view to see the sum of log messages over time